Internet Explorer debug tutorial
When creating a website or application, it is very common to run into bugs of all sorts. One of the most appreciated features of browsers these days is the provision of debugging tools.
Whether you’re using Google Chrome, Firefox, or good ole fashion Internet Explorer, a debugging feature often referred to as developer tools are always available.
The approach at which these debuggers work does vary depending on the browser standards, so while Chrome might not flag a few script issues, internet Explorer might.
It is important to test run your websites and web applications across multiple browsers before making it live.
This article will focus mainly on how Internet Explorer debug works using IE version 11 and explore the different web technologies (Javascript & CSS) it allows you to debug.
But First;
What is F12 Developer Tools in Internet Explorer 11
F12 Developer Tools are a toolkit built for inspecting HTML Element trees, CSS code, debugging javascript errors and measuring website browser resource & network usage all in a single interface.
It is made up of 6 main tabs, which all have dedicated features that can be used to inspect, debug & monitor a site or web application.
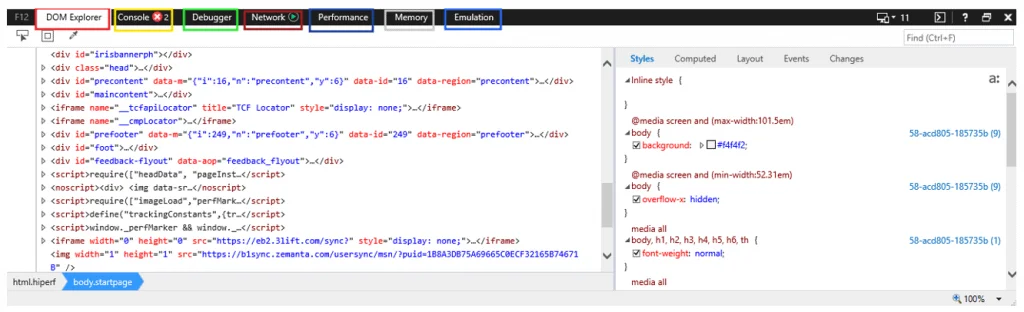
DOM Explorer: The Document Object Model (DOM) Explorer allows you to get a tree-like visualization of the HTML and CSS source code of a current webpage.
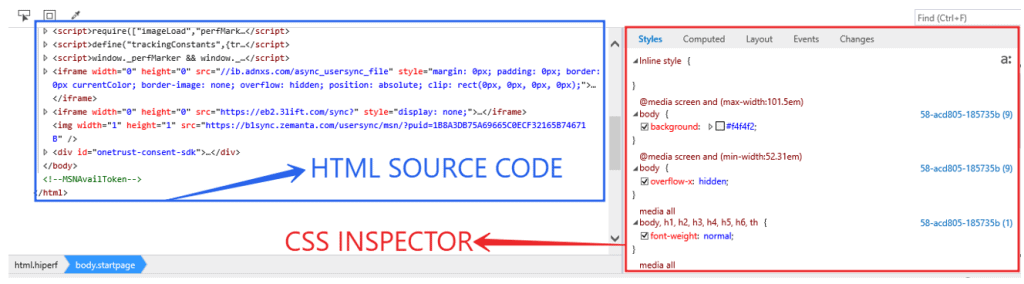
In Internet Explorer 11, it can be used for tracing and debugging HTML and CSS errors.
Console: When detecting Javascript errors for debugging on Internet Explorer, the Developer tools Console is the go-to.
It catches any error thrown while javascript is running and points to the line where the errors were detected in the debugger.
It also allows you to run arbitrary Javascript code with its input, which can be useful for security tests and other debugging forms.
Debugger: The internet explorer 11 developer tools debugger is a utility that loads the entire source code of a current webpage and allows you to block out, add, and fast run your code.
It is mainly used for tracing and fixing javascript errors, and performance issues.
Network, Performance & Memory Tabs: Internet Explorer Developer tools also make it possible to monitor things like HTTP requests, memory usage, and other performance-related information.
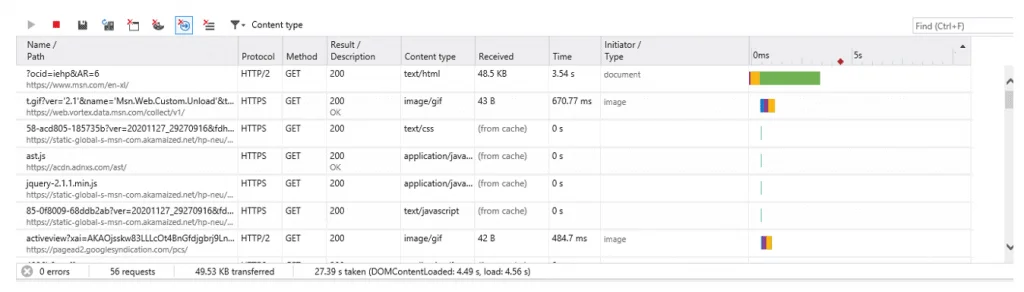
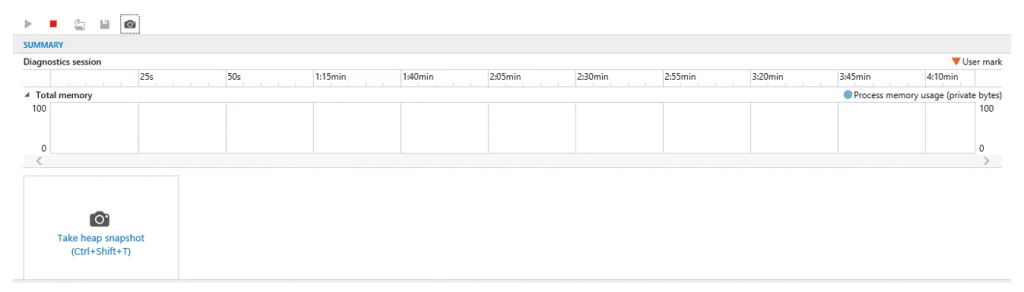
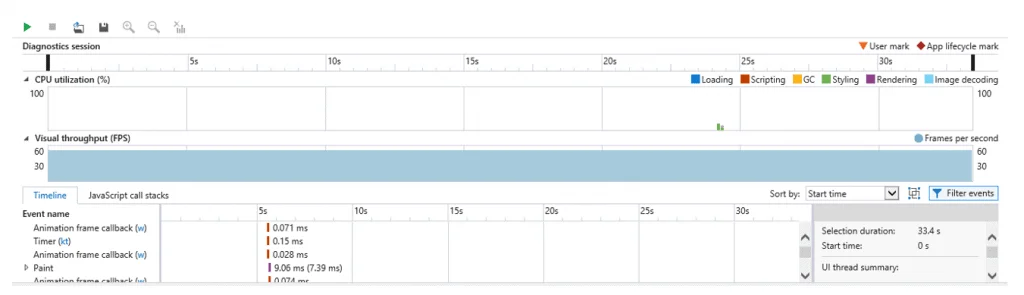
These tools work hand in hand with the debugger to help users view failed requests (Status code: 404, 301, etc.), scripts using too much memory, and detecting performance-related issues.
Ok, now that we have a good understanding of how the Internet Explorer Developer tools work, let’s learn how to enable IE 11 developer tools and use them to debug an existing web app.
How to Enable F12 Developer Tools in Internet Explorer 11
To enable internet explorer developer tools, use the following steps:
- Open Internet Explorer
2. Navigate to the webpage you want to inspect/debug
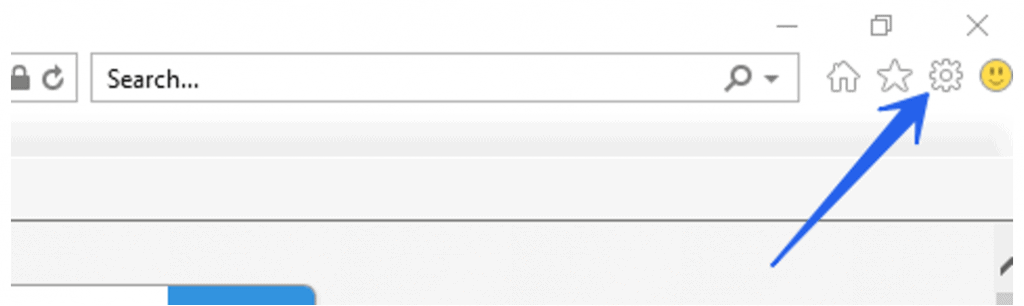
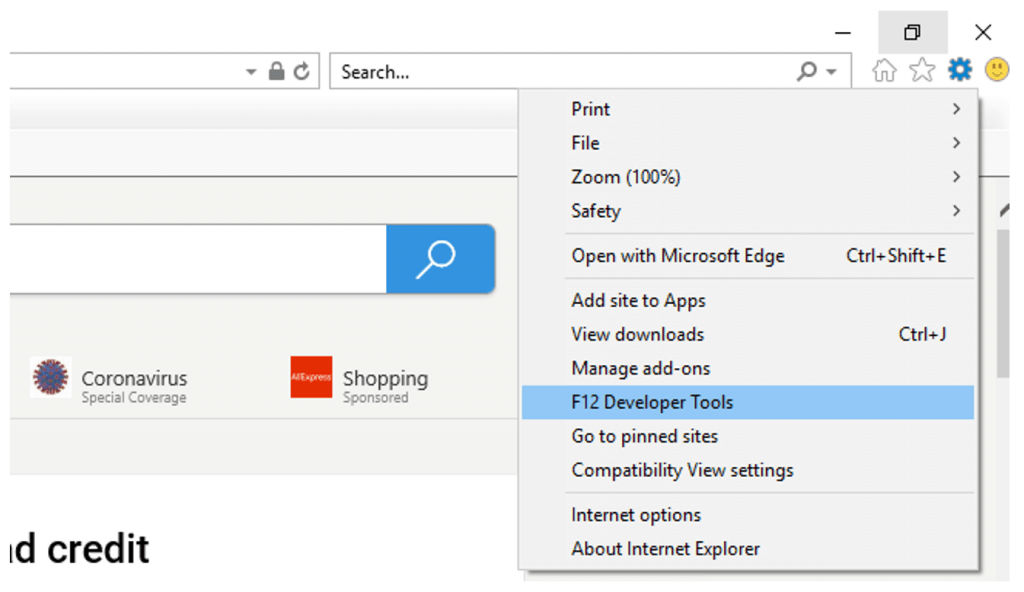
3. Click on the Gear settings icon at the top right of Internet Explorer & Select F12 Developer Tools from the drop-down menu.
You can also enable internet explorer developer tools by pressing the F12 function key on the webpage you need it on.
How To Debug Javascript With Internet Explorer 11 (Using F12 Development Tools)
To debug a javascript application on internet explorer 11, follow the steps listed below;
- STEP 1: Open the page you’re trying to debug for javascript errors
- STEP 2: Open Developers tools either via the gear icon or Pressing F12 on your keyboard
- STEP 3: Navigate to the Console pane, and below you should see a list of detected javascript errors
- STEP 4: Click on the Line number provided by the console to locate the code responsible for generating the bug
- STEP 5: Read the error and correct it accordingly.
That’s on a basic level, how debugging javascript works on Internet Explorer 11, to explain things better, here’s an example that illustrates this practically.
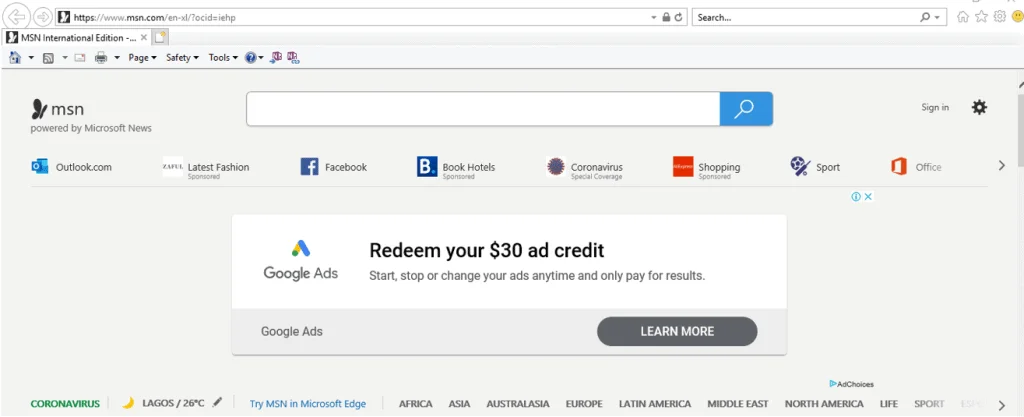
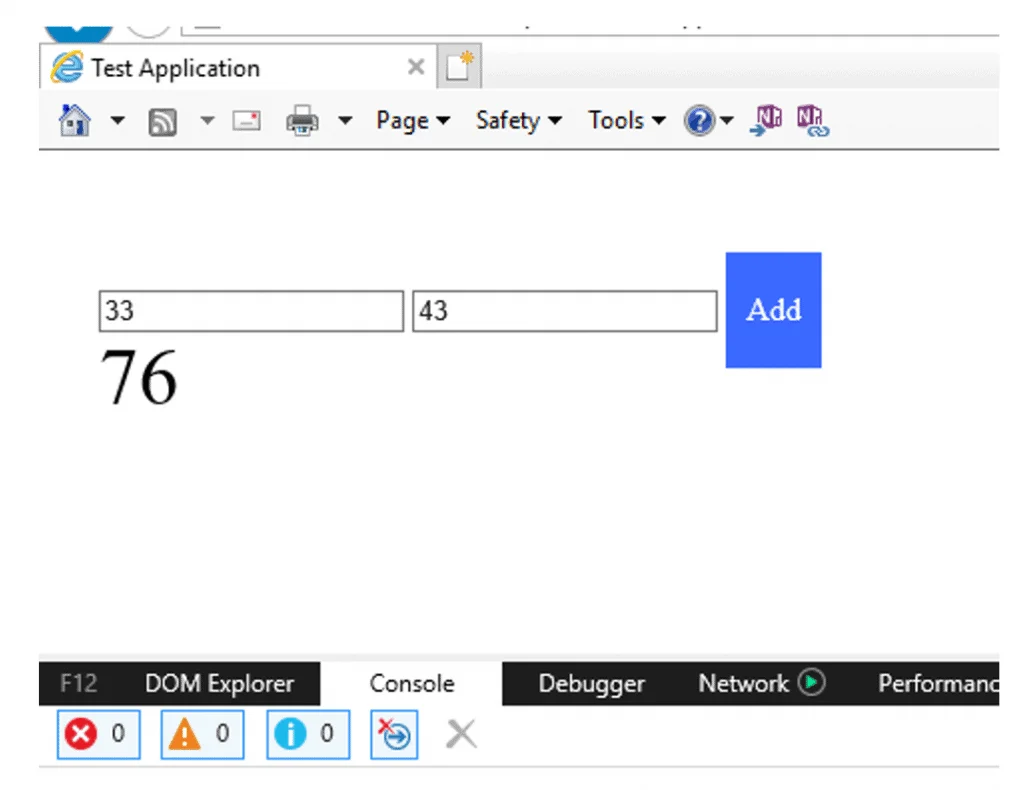
We’re going to debug a simple test web application built with javascript.
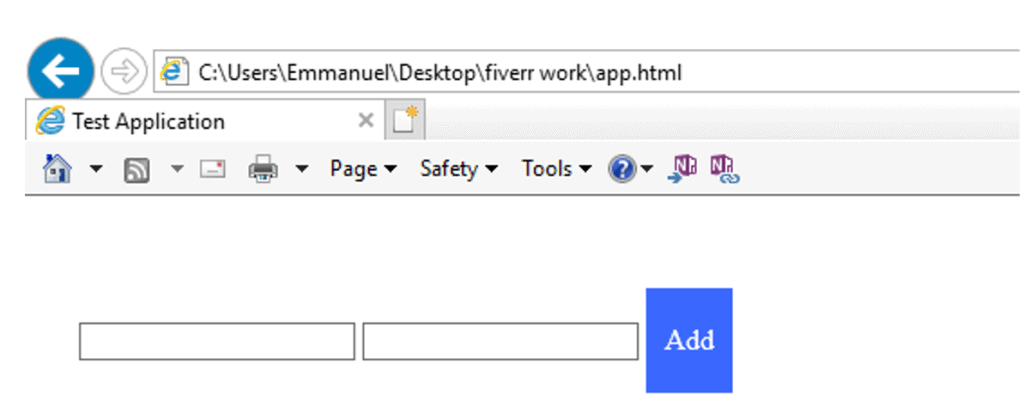
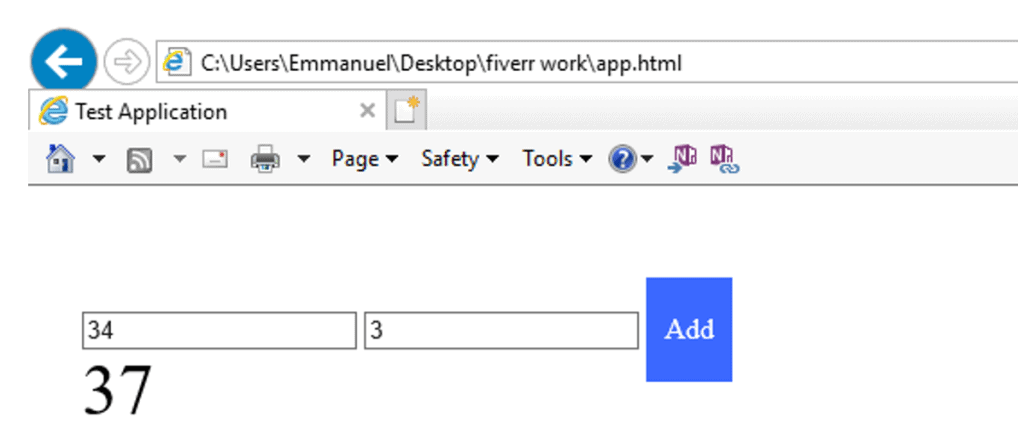
The image above shows how the App looks like on Internet Explorer 11 when the file is opened; all it does is accept two numbers and give an output.
Right now, this is working perfectly well, but for this tutorial’s sake, we’re going to modify the source code so it throws several errors and learn how to detect and fix them with the F12 developer tools.
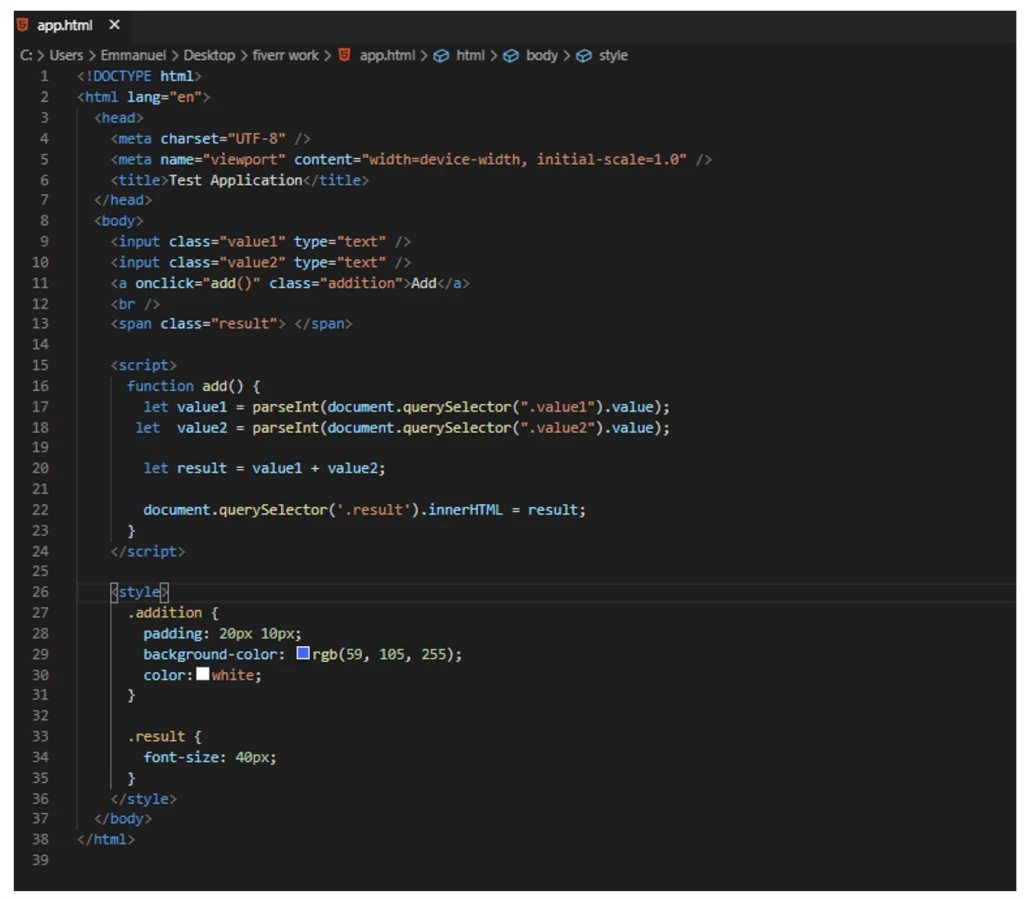
The image above is the App’s source code, and as you can see, it’s fairly straightforward.
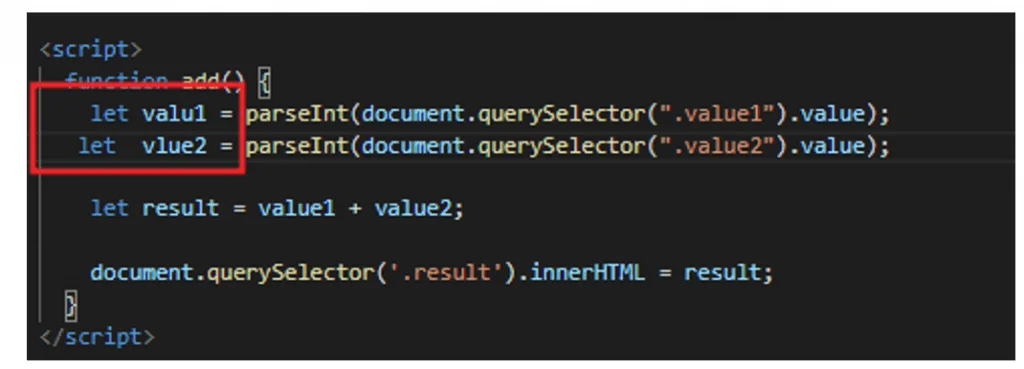
Let’s trigger a bug by misspelling the variable names Value1 & Value2 and see what happens on the internet explorer debug tab.
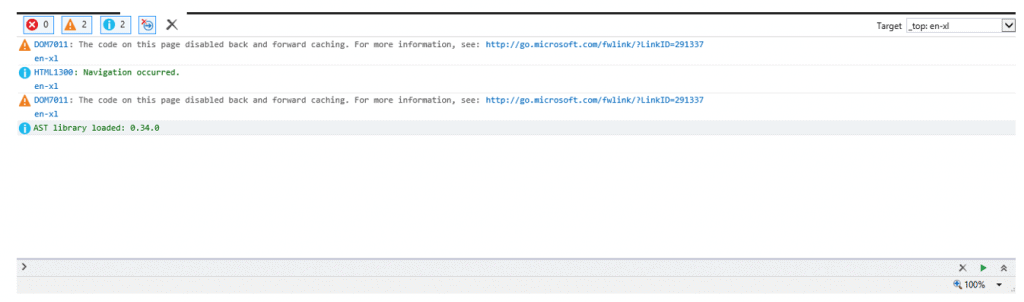
With that done, I’ll refresh the page on internet explorer, fill in two numbers, click the add button and see if what happens on the console.
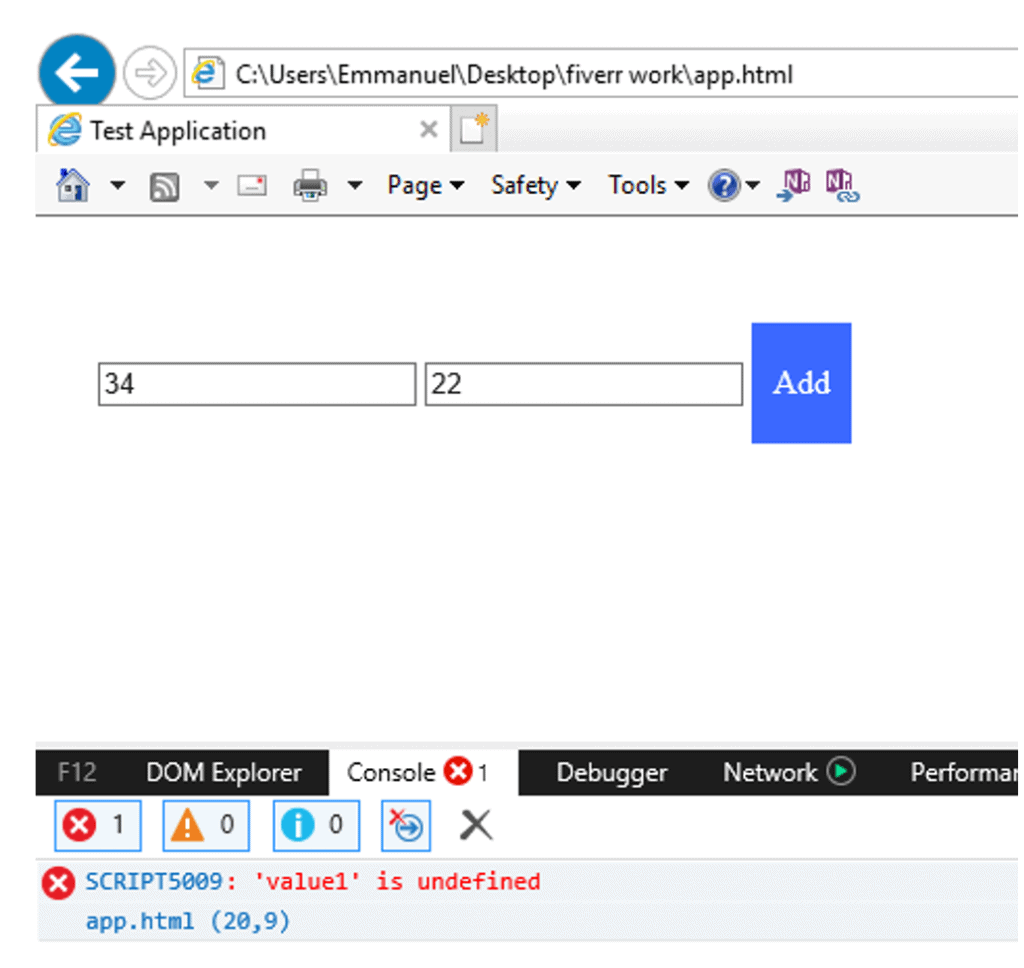
As you can see from the screenshot above, the console has caught the first error thrown during the code execution process (which is value1 being undefined).
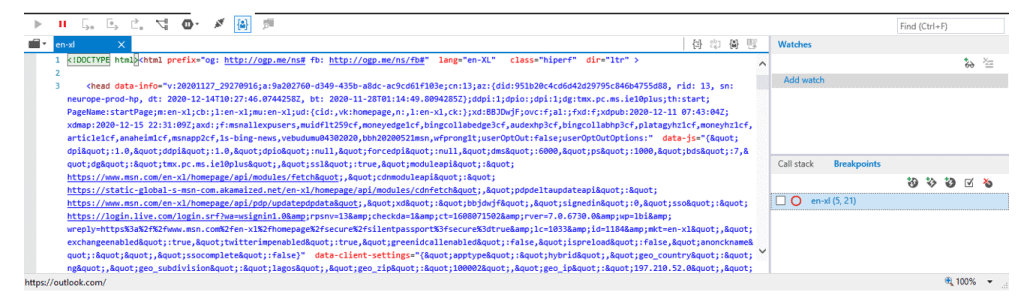
If you click on the Line code below the error message, it should take you to the location in the debugger like so;
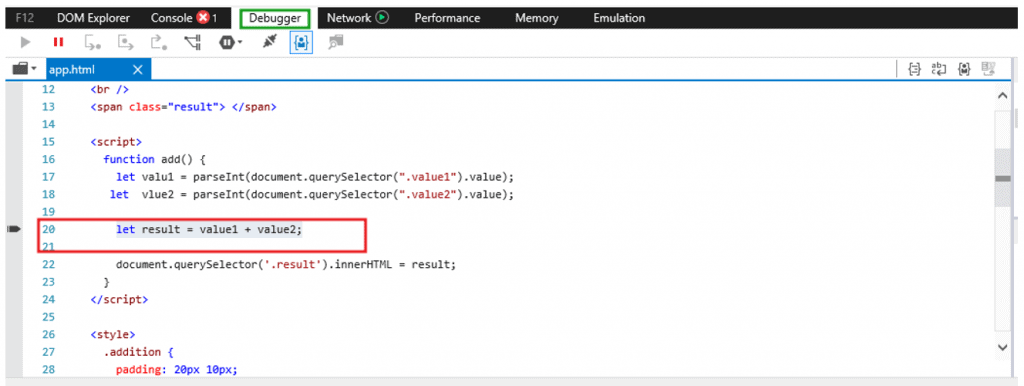
To debug this error, we need to change the variable names on line 20 to match how defined them on line 17 & 18.
With that done, after a page refresh, we should no longer get that particular error.
If there are any other errors, the console will detect them as thrown during processing time.
The Developer tools debugger is capable of a lot more than just detecting and fixing simple bugs.
It also has advanced features like code isolation, also referred to as break, which allows you to exclude a part of your code right from your browser in runtime and fix buggy features.
It also has features like exception handling, watches, and breakpoints, which might sound a bit advanced but in use makes debugging way much easier.
What is DebugBar in Internet Explorer 11?

Debug bar is a Third-party add-on debugger that streamlines & provides extended functionality feature-set to the built-in developer tools.
It’s just like the default Internet explorer debugger, but on steroids, it’s the Firebug alternative for Internet Explorer.
It packs a lot of cool features like;
- Viewing original ad interpreted source code
- Ability to view HTTP and HTTPS headers
- Validating HTML code for pages (including frames/iframes)
- Executing script code in the currently loaded page
Debugbar is more like an upgrade because even with the built-in IE debugger, you can achieve a lot.
You can download & install DebugBar for free from their official site.
Troubleshooting Internet Explorer Debugging Feature
How to Fix: Internet Explorer 11 debugger not working for Windows 7
If the F12 Internet Explorer 11 debug feature refuses to work on your window 7 installations, a simple update should fix it.
If you use a 32-bit system, download the update from this URL: https://www.microsoft.com/en-us/download/confirmation.aspx?id=45134
You can download For 64 bit systems also through this link: https://www.microsoft.com/en-us/download/confirmation.aspx?id=45154
Once the update is completed, restart IE 11, and the debug feature should 9/10 times be fully functional.
How to Fix: Internet Explorer 11 debugger not working for Windows 10 [Blank Screen]
In most cases, you’re using a 64-bit system as that’s the system version that triggers the blank screen debugger error.
When Internet Explorer is unsure of what system version you are using, it just guesses, and this causes misconfiguration.
Fixing this is relatively easy as we have to tell internet explorer the exact system version we are on; follow the steps listed below to achieve that;
- Goto Control Panel (Ctrl + Alt + C) Panel\System and Security\System path on your PC & verify your system version (32/64 bit)
- Open Internet Explorer and go to Settings
- Find Internet Options
- Select the Advanced tab
- Find Security & checkmark “Enable 64-bit processes for Enhanced Protection Mode*”
- Click ok & Restart Internet Explorer
With that, you should have IE dev tools and debugger working again.
Conclusion
This article has gone over how debugging works in Internet Explorer works on Internet Explorer 11 with a good example demonstrating the practical process.
The debugging feature on IE 11 might not be the best in the world per se but does get the job done in most cases.
To get past its limitations, third-party debugging add-ons like DebugBar do a great job and make debugging much easier.
We hope you’ve found this article useful. If you have any questions about the Internet Explorer debug feature, please do not hesitate to leave a comment below.