How to debug your JavaScript Code
The process of debugging is quite tedious and tiring. The skill of debugging should be mastered by every developer. The code is always prone to errors since it is written by humans not machines. We can not totally eliminate the bugs but can deal with an error in a graceful manner and debug any errors that come in the way.
We shall learn how to debug a javascript code. The good thing is that almost any modern HTML supported browser such as Chrome, Firefox, Safari, etc comes built-in with a javascript debugger that makes the development and debugging of a program really easy. Let’s start!
Best Practices to Follow
Taking the method of prevention is always better than cure. It is good to prevent our code from becoming prone to bugs and debug it in the later stages. A single piece of code can be written in many ways. This really shows the difference between beginner and professional code development. A well-structured code allows better debugging in any later step of the process and removing errors. Let us learn the basic methods on how to achieve this.
Methods for Debugging
The JavaScript Console Method to Debug
The JavaScript console API can be used for debugging code in javascript. There are various available options to use the JavaScript console API. Let us start with different console methods.
- Console.log Method: The console.log() function can be used to print out any values, strings, objects, etc in the debugger window of your HTML supported browser such as Chrome.
Example Code:
function addition(number1, number2) {
return number1 + number2
}
let number1 = 20, number2 = 30;
let output = addition(number1, number2);
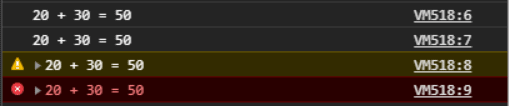
console.log("%d + %d = %d", number1, number2, output);
console.info("%d + %d = %d", number1, number2, output);
console.warn("%d + %d = %d", number1, number2, output);
console.error("%d + %d = %d", number1, number2, output);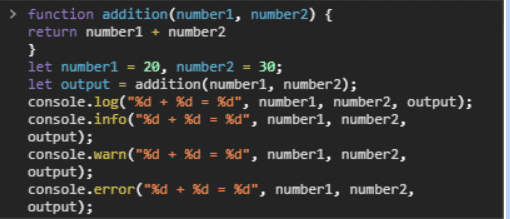
OUTPUT:
- Console.table Method: In this JavaScript function, we must provide at least one mandatory argument data that can be either an array or an object. The second parameter is additional and optional columns or arrays of string. It will print the data as a table. The syntax is console.log(data, obj).
Example Code
function Friends(Maidenname, Familyname, rollnumber) {
this.Maidenname = Maidenname;
this.Familyname = Familyname;
this.rollnumber = rollnumber;
}

var Abdullah = new Friends("Abdullah", "Saeed", 1);
var Talha = new Friends("Talha", "Ikram", 2);
var Sherry = new Friends("Sherry", "Perry", 3);

console.table([Abdullah,Talha,Sherry],["Maidenname","Familyname"]);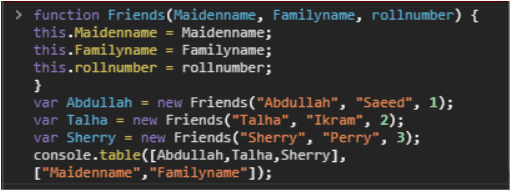
Output
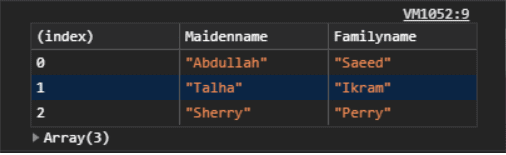
The table is displayed due to the following piece of code:
console.table([Abdullah,Talha,Sherry],[“Maidenname”,”Familyname”]);
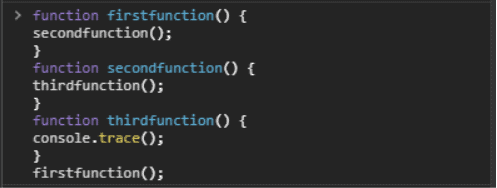
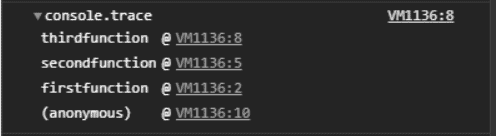
- Console. trace Method: This JavaScript function allows you to see the call path and takes you to the point where console.trace() is called.
Example Code:
function firstfunction() {
secondfunction();
}

function secondfunction() {
thirdfunction();
}

function thirdfunction() {
console.trace();
}

firstfunction();
Chrome Browser View:
Output:
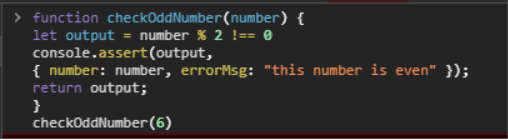
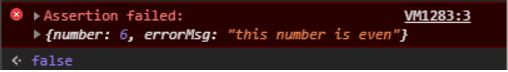
- Console. assert Method: This JavaScript function writes an error message on the screen if the said assertion is false. In the case of true, nothing will happen.
Example Code
function checkOddNumber(number) {
let output = number % 2 !== 0
console.assert(output,
{ number: number, errorMsg: "this number is even" });
return output;
}

checkOddNumber(6)
Chrome Browser View
Output
Using a Debugger
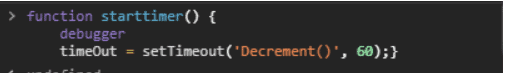
The word Debugger is a reserved keyword since the ES5 version of JavaScript. It has support in later versions as well. Once we place the debugger inside our code, it halts the current execution of JavaScript.
In case the inspector tool is opened, it will be able to detect the effect and we shall be able to continue debugging.
Example Code:
function starttimer() {
    debugger
    timeOut = setTimeout('Decrement()', 60);
}
Chrome Browser View:
Output:
The code will stop execution before the third line.
Use of Breakpoints to Debug
There are a number of methods to debug our code. At each breakpoint reached, JavaScripts halts the execution and allows us to examine values and remove errors.
Unconditional Breakpoints
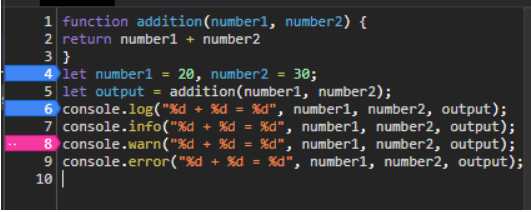
An unconditional breakpoint is when we pause the execution at a specific line number. Setting an unconditional breakpoint is really easy. Just click on the line number left to it. This really helps in debugging.
Example Code:
function addition(number1, number2) {
return number1 + number2
}

let number1 = 20, number2 = 30;
let output = addition(number1, number2);

console.log("%d + %d = %d", number1, number2, output);
console.info("%d + %d = %d", number1, number2, output);
console.warn("%d + %d = %d", number1, number2, output);
console.error("%d + %d = %d", number1, number2, output);
Chrome Browser View:
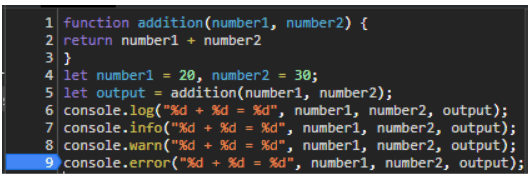
The blue highlighted line is set for an unconditional breakpoint. Click it to remove the breakpoint.
Breakpoint List
Whenever we mark a line of code for a breakpoint, a list appears with the details such as the filename and line number of each breakpoint.
Example Code:
Click on the checkbox to remove the breakpoint. It can be seen in the window.
Addition of Log points
In case we want to view the value of a variable without having to pause the execution, we can make use of log points in your browser.
Log points print a message to the javascript console without halting or pausing the execution of the code. The line with the set log point is enlarged. They can also be viewed in the panel of breakpoints. In order to add a log point, simply right-click on the desired line and choose the option to add a log point.
Example from Chrome Browser Window:
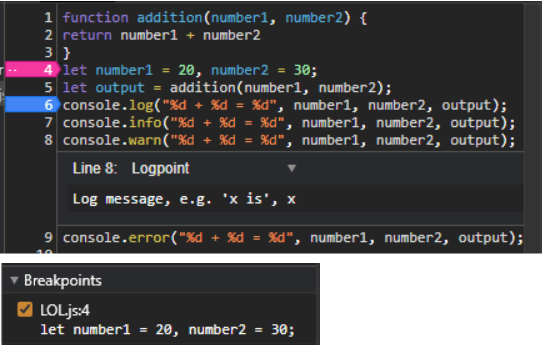
Line number 4 has a log point in the above code.
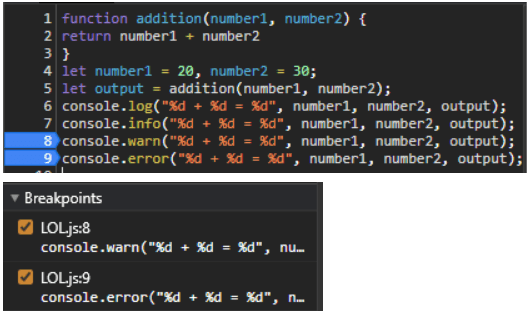
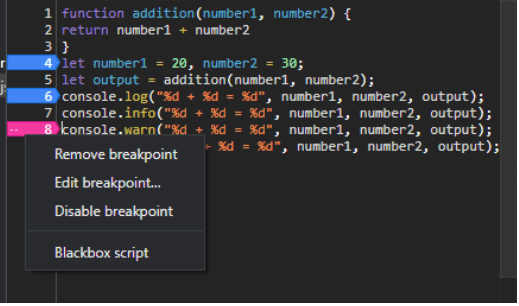
Removing or Unsetting a Breakpoint
Once a breakpoint is set in a browser, it can be removed easily. Simply right-click to remove it.
Line 8 has a breakpoint in the following code.
Right-click and remove breakpoint from the opened browser menu window.
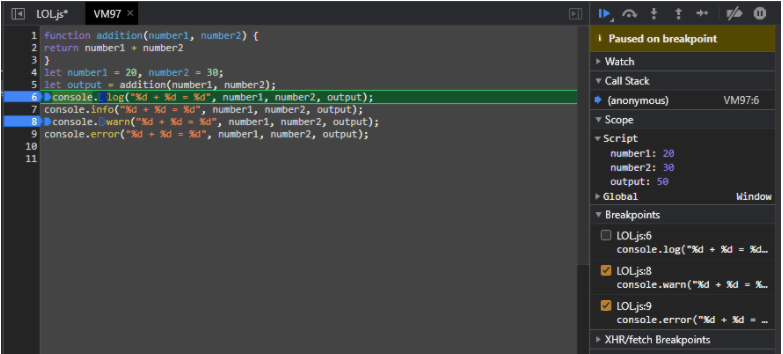
Using the Call Stack to Debug
This stack goes from bottom to up. If enabled with a breakpoint, it shows the function calls one after another. The first executed function stays at the bottom of the list and so on. This allows a step-by-step debug solution for your problem. Any modern browser will show it. Each step will show the process along the way and allow you to debug your code.
Javascript debug in Node.js
###What is Node.js ?
Node.js is an open source JavaScript server-side platform geared towards highly competitive event-driven networking applications that need to be scalable. The Javascript code is executed outside a web browser.
###How to debug in Node.js
Unlike using Javascript in a web browser, or unlike other languages like Java with powerful IDE, Node.js has not a smart and easy way to test and debug your script.
Console.log()
You can use the good old one Console.log(). It is the fastest way to get informations about where you are in the script, the value of some variables, even their type, and can let you see a step by step debug test.
But we are in 2021.
Chrome DevTools
You can use the Chrome DevTools to debug Node.js as explained in this blog post, but reading some feedback, it seems not to be the easiest solution as the configuration of the tool and the link between Node.js and Chrome DevTools is a bit tricky.
Inspect command
Node.js provides documentation to understand how to debug with the inspect command and where to start : https://nodejs.org/en/docs/guides/debugging-getting-started/
Visual Studio Code
Visual Studio Code is an open source code editor made by Microsoft and one of the most powerful one.
For Node.js development, it allows to simply manage all the files of your project, to visualize and edit file and script and to debug easily the code.
You can use an interactive and advanced visual debugger to set breakpoints and access quickly to the value of each variable and understand the logic of the code to find where the bug is.
You can debug local or remote.
Conclusion
In this article, we discussed major ways to ease the life of the javascript developer. There are many other ways and tools to debug our code. We have just discussed the basic ways of debugging in javascript. By implementing these ideas, you should be able to start debugging any code and start deploying code free of error. Some built-in tools also allow to debug code in your browser. Make sure to check any javascript program you write. Check online resources on the web, become the master of debugging, and continue to learn.
Featured image : Photo by Pankaj Patel on Unsplash